The visualization tool provides a comprehensive view of last-mile delivery by enabling users to see the complete delivery route from warehouse to customer, including the order in which customers are served. By offering a clear visual representation of last-mile operations, the tool enhances communication, simplifies data interpretation, and supports effective supply chain management.
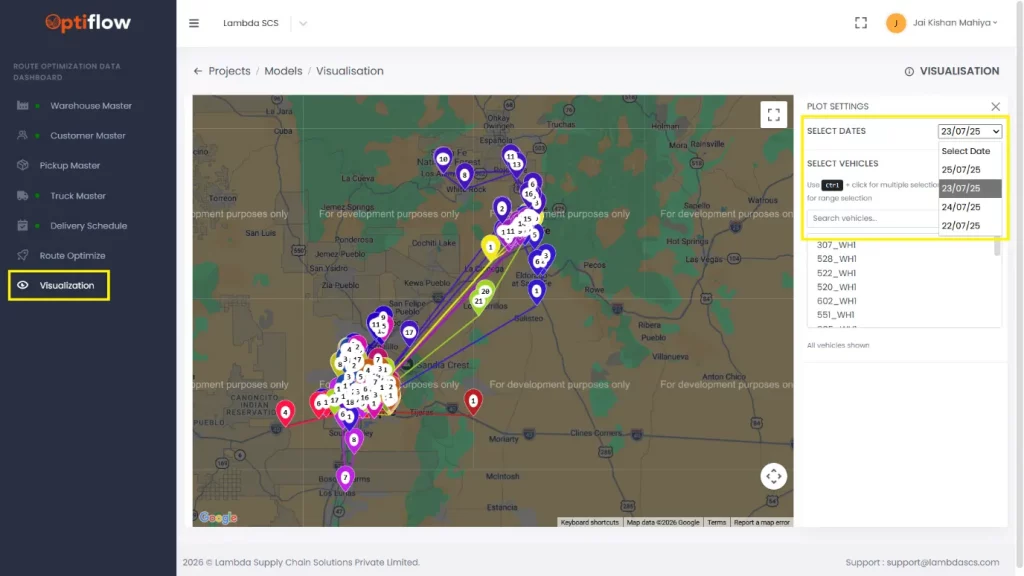
This feature can be used to customize the visualization based on our requirement. Using the Select Dates feature, users can view the visualization for a specific date.
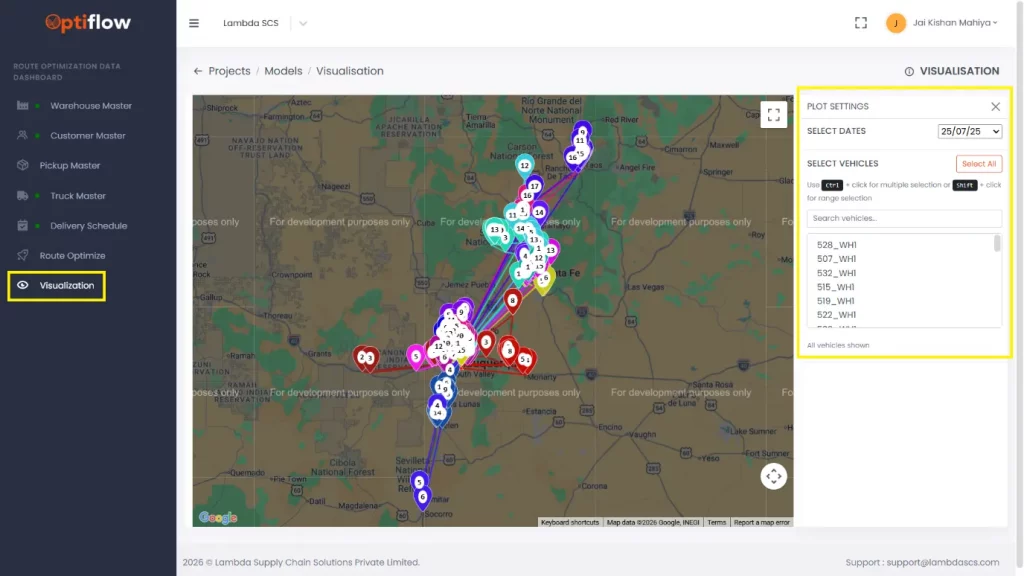
This feature allows users to customize the visualization based on their requirements. Using the Select Vehicles option, specific vehicles can be included or excluded from the visualization, helping to streamline data interpretation.
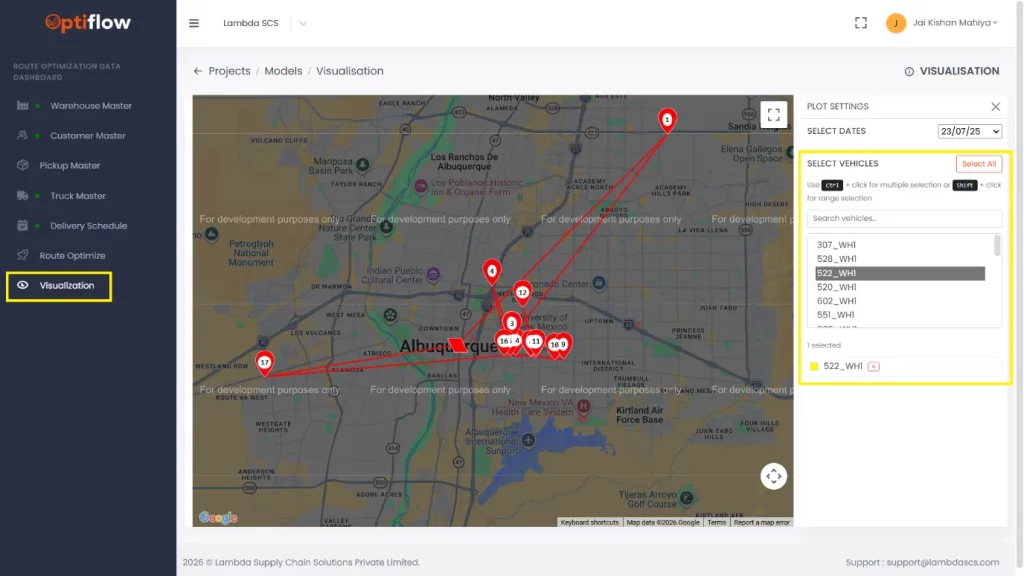
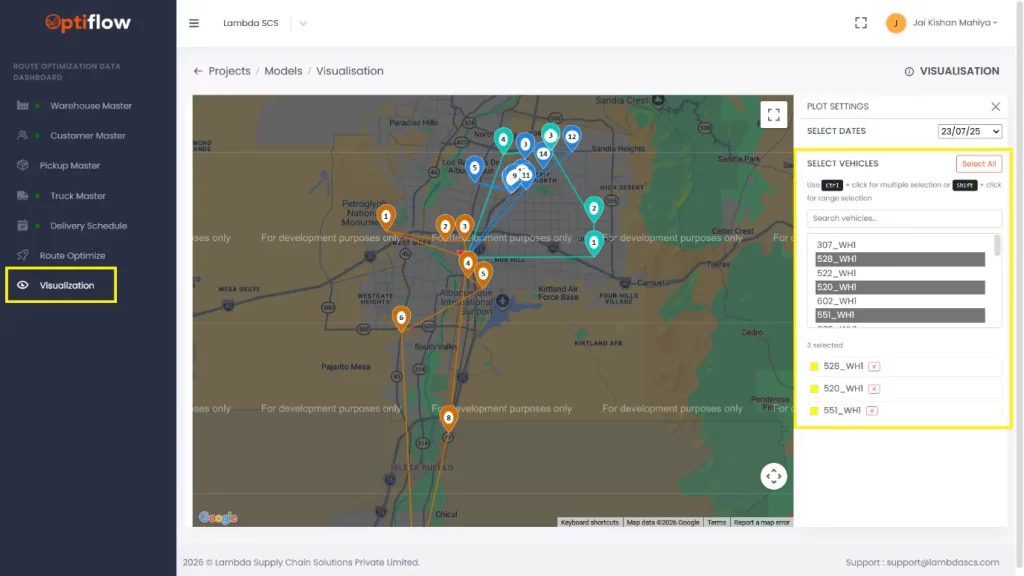
Examples are shown where routes are displayed only for the selected vehicles.